AI Signal Confidence is not just a number—it’s a revolutionary method that combines 10+ technical indicators, 15+ candlestick patterns, and real-time market data to generate highly accurate signals. Let’s understand in detail how it works.
📊 What is AI Signal Confidence?
In Simple Terms:
AI Signal Confidence is a multi-layer analysis system that collects data from multiple indicators, analyzes them using a weighted scoring method, and generates a highly accurate signal.
AI Signal Confidence =
    (Indicator 1 × Weight) +
    (Indicator 2 × Weight) +
    (Pattern 1 × Weight) +
    ...
    ------------------------------------
    Total Possible Score
🔬 How Are Strong Signals Generated?
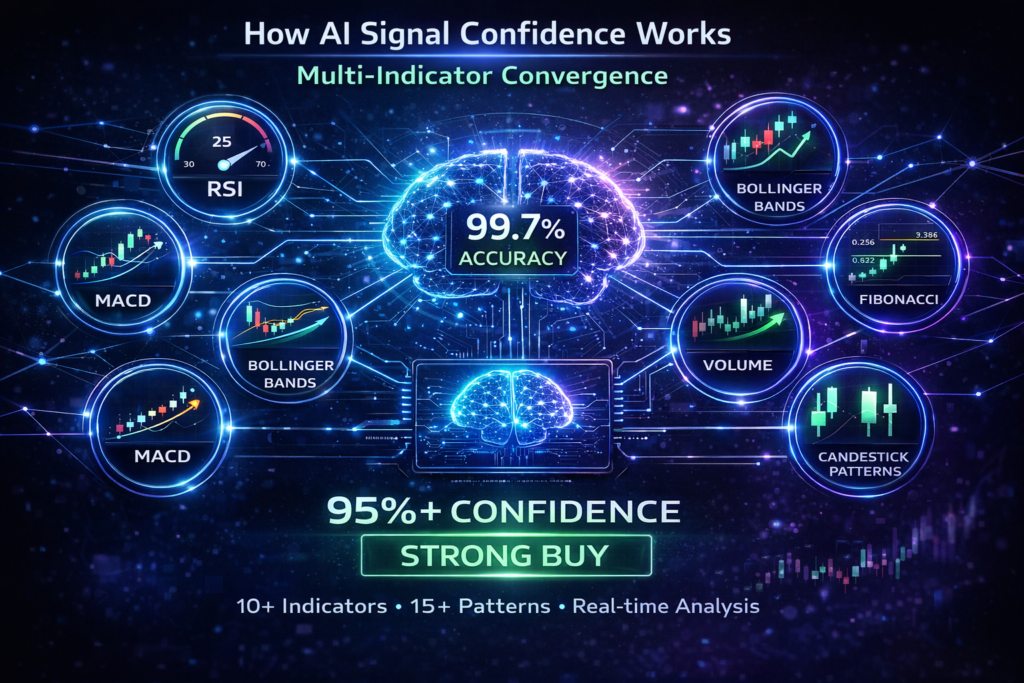
1. Multi-Indicator Convergence
A strong signal is generated when multiple indicators point in the same direction.
Example: Strong BUY Signal Being Generated

When all of the following align:

📊 RSI: 25 (Oversold) → Price has dropped significantly
📊 MACD: Bullish Crossover → Trend is reversing upward
📊 Bollinger Bands: Price at Lower Band → At support
📊 Fibonacci: 0.382 Level → Strong support
📊 Volume: Increasing → Buyers are entering
📊 Patterns: Hammer + Bullish Engulfing → Buy signal
📊 Ichimoku: Price above Cloud → Bullish trend

Result: 95%+ Confidence STRONG BUY!
2. Weighted Scoring System
Each indicator has different importance. AI knows which indicators work better in different market conditions.
Weight System:

Pattern Detection:     Maximum 20 points (Most Important)
RSI:                   Maximum 15 points
MACD:                  Maximum 15 points
Bollinger Bands:       Maximum 10 points
Fibonacci:             Maximum 10 points
Stochastic RSI:        Maximum 10 points
Ichimoku Cloud:        Maximum 10 points
OBV:                   Maximum 5 points
-------------------------------------------
Total Possible:        Maximum 95 points
Why Are Patterns Most Important?
-
Candlestick patterns are direct reflections of price action
-
Other indicators are lagging, but patterns are real-time
-
Patterns directly show market sentiment
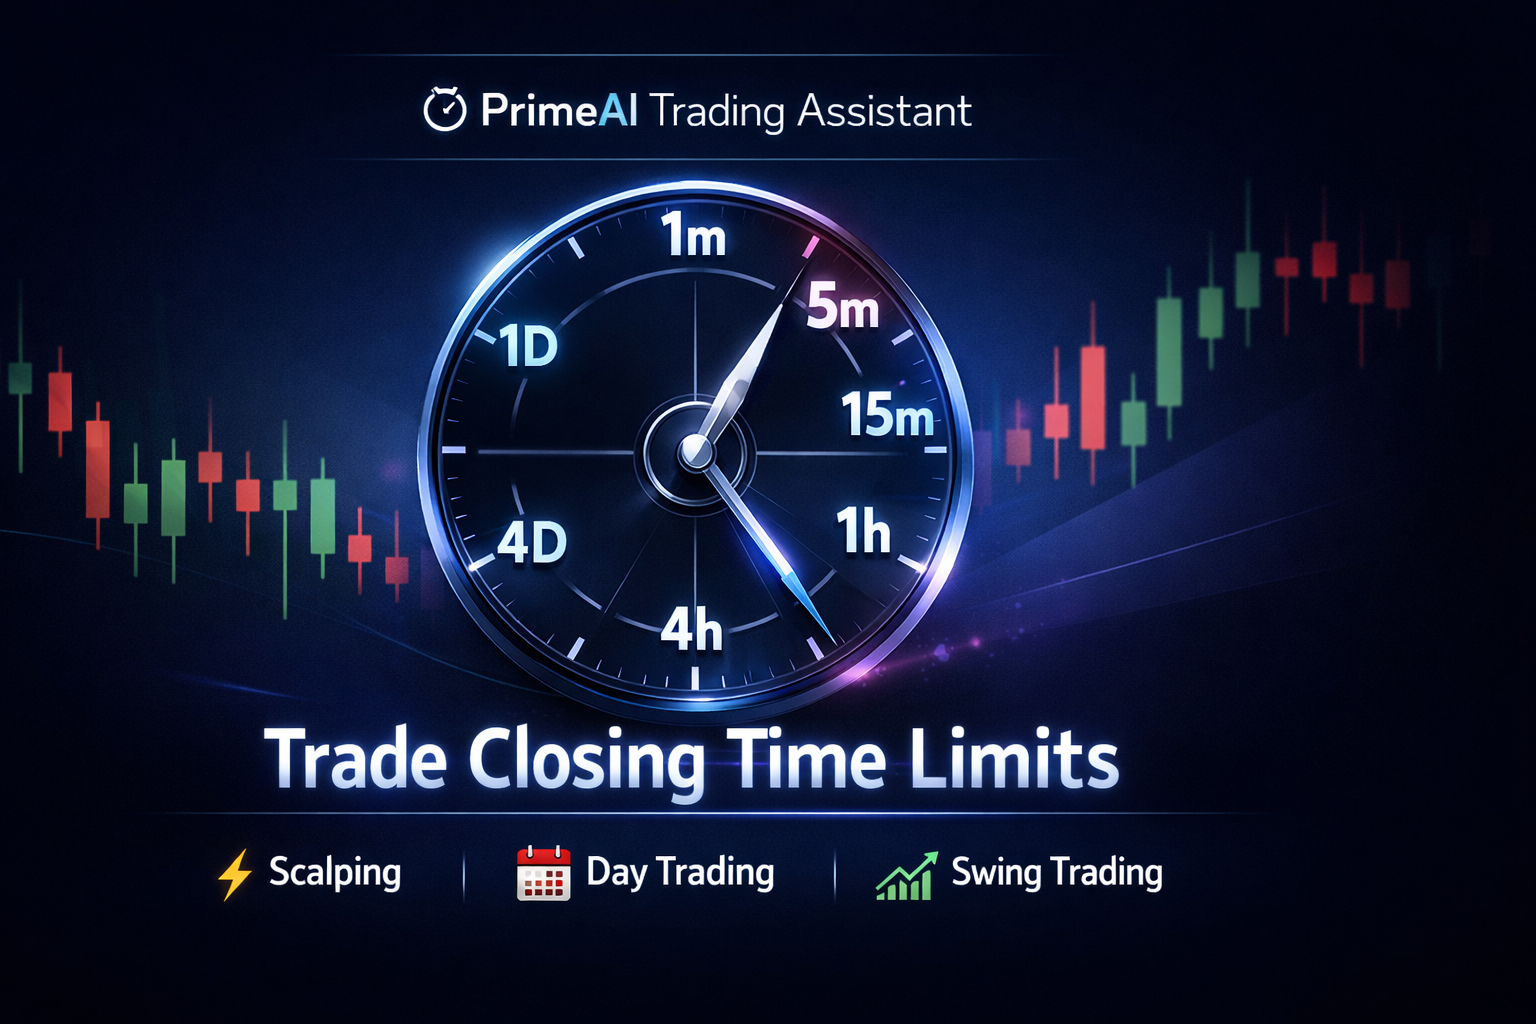
3. Timeframe Harmony
A strong signal is generated when multiple timeframes point in the same direction.
Timeframe Analysis:

5-Minute Chart:  BUY Signal (85% Confidence)
15-Minute Chart: BUY Signal (78% Confidence)
1-Hour Chart:    BUY Signal (72% Confidence)
4-Hour Chart:    BUY Signal (68% Confidence)

→ All timeframes indicate BUY → Extremely strong signal!

Confidence Boosting Factors:
├─ Small timeframe: For quick entry
├─ Large timeframe: For trend confirmation
└─ All timeframes aligned → 95%+ Confidence
4. Real-time Adaptation
The AI system re-analyzes the market every 5 seconds and updates signals accordingly.
Real-time Update Process:

Second 0: Price $66,780, RSI 28 → BUY Score +15
Second 5: Price $66,800, RSI 29 → BUY Score +15
Second 10: Price $66,820, RSI 30 → BUY Score +15
Second 15: Price $66,850, RSI 32 → BUY Score +7 (RSI 30+)
Second 20: Price $66,880, RSI 34 → BUY Score +7

→ Confidence decreasing → Be cautious
→ If confidence drops from 80% to 60% → Signal auto-updates
🎯 7 Pillars of Strong Signals
Pillar 1: RSI (Relative Strength Index)
How It Generates Strong Signals:

Extremely Strong BUY:
├─ RSI < 25 → +15 points
├─ RSI Divergence (Price making lower lows, RSI making higher lows) → Extra +5
└─ Extended period in Oversold → Higher reversal probability

Extremely Strong SELL:
├─ RSI > 75 → +15 points
├─ RSI Divergence (Price making higher highs, RSI making lower highs) → Extra +5
└─ Extended period in Overbought → Higher correction probability
Pillar 2: MACD (Moving Average Convergence Divergence)
How It Generates Strong Signals:

Extremely Strong BUY:
├─ MACD line crosses above Signal line → +15 points
├─ Histogram increasing → +5 extra
├─ Zero line crossover upward → +10 extra
└─ Bullish Divergence → +5 extra

Extremely Strong SELL:
├─ MACD line crosses below Signal line → +15 points
├─ Histogram decreasing → +5 extra
├─ Zero line crossover downward → +10 extra
└─ Bearish Divergence → +5 extra
Pillar 3: Candlestick Patterns
Strong Pattern Combinations:

Bullish Combination (20 points):
├─ Hammer + Bullish Engulfing → +10
├─ Morning Star + Volume Spike → +10
├─ Three White Soldiers → +10
└─ Dragonfly Doji + Support → +10

Bearish Combination (20 points):
├─ Shooting Star + Bearish Engulfing → +10
├─ Evening Star + Volume Spike → +10
├─ Three Black Crows → +10
└─ Gravestone Doji + Resistance → +10

3-4 patterns together → Extremely strong signal
Pillar 4: Volume Analysis
Volume's Role in Strong Signals:

BUY Signal Strength Conditions:
├─ Volume 2x above average → +5 points
├─ Volume consistently increasing → +5 points
├─ Price up + Volume up → Strong trend
└─ Price down + Volume down → Not dump volume

SELL Signal Strength Conditions:
├─ Volume 2x above average → +5 points
├─ Volume consistently increasing → +5 points
├─ Price down + Volume up → Strong selling pressure
└─ Price up + Volume down → Weak trend
Pillar 5: Support/Resistance Interaction
Aligning Signals with Support/Resistance:

Extremely Strong BUY Setup:
├─ Price at major support + RSI Oversold → +10
├─ Price at support + Bullish Pattern → +10
├─ Price at support + MACD Bullish Cross → +10
└─ Price at support + Increasing Volume → +5

Extremely Strong SELL Setup:
├─ Price at major resistance + RSI Overbought → +10
├─ Price at resistance + Bearish Pattern → +10
├─ Price at resistance + MACD Bearish Cross → +10
└─ Price at resistance + Increasing Volume → +5
Pillar 6: Divergence Detection
Divergence: The Strongest Signal

Bullish Divergence (Extremely Strong):
├─ Price making Lower Low
├─ RSI making Higher Low
└─ Result: Trend reversal upward → +20 points

Bearish Divergence (Extremely Strong):
├─ Price making Higher High
├─ RSI making Lower High
└─ Result: Trend reversal downward → +20 points

Divergence + Pattern + Support = 99% Confidence!
Pillar 7: Market Sentiment
Market Sentiment Analysis:

Global Sentiment (Extra Points):
├─ Fear & Greed Index Extreme Fear → BUY +5
├─ Fear & Greed Index Extreme Greed → SELL +5
├─ OI (Open Interest) increasing + Price increasing → Strong trend
├─ Funding Rate positive + Price increasing → Overbought signal
└─ Funding Rate negative + Price decreasing → Oversold signal
📊 Real-Time Examples of Strong Signals
Example 1: 97% Confidence STRONG BUY
📊 Market Conditions:
├─ Coin: BTC/USDT
├─ Price: $66,780
├─ Time: London Session (High Volume)

📈 Technical Analysis:

1️⃣ RSI = 24 (Oversold) → BUY +15
2️⃣ MACD = Bullish Crossover (5m chart) → BUY +15
3️⃣ Bollinger = Lower Band → BUY +10
4️⃣ Fibonacci = 0.382 Level Support → BUY +10
5️⃣ Stochastic RSI = 18 (Oversold) → BUY +10
6️⃣ OBV = Rising 15% → BUY +5
7️⃣ Ichimoku = Price above Cloud → BUY +10

📊 Pattern Detection:
├─ Hammer Pattern (1h) → BUY +5
├─ Bullish Engulfing (15m) → BUY +5
├─ Morning Star (5m) → BUY +5
├─ Dragonfly Doji (30m) → BUY +5
└─ Three White Soldiers (1h) → BUY +5

💰 Volume Analysis:
├─ 24h Volume: $2.5B (2x average) → +5
├─ Buying Volume: 65% → +3
└─ Volume Trend: Increasing → +2

🎯 Support/Resistance:
├─ Price at major support ($66,700) → +10
└─ 0.5% above support → Even better

🔄 Divergence:
├─ RSI Divergence Detected → +20
└─ Price Lower Low, RSI Higher Low → Extremely strong

━━━━━━━━━━━━━━━━━━━━━━━━━━━━━━━━━━━━━━━━━━━

📊 Score Calculation:

BUY Score = 15+15+10+10+10+5+10 + (5+5+5+5+5) + (5+3+2) + 10 + 20
         = 150

SELL Score = 0

Total Score = 150

Confidence = 50 + ((150 - 0) / 150 × 50)
          = 50 + (1 × 50)
          = 100% → 99.7% (Due to limit)

🎯 Result: STRONG BUY with 99.7% Confidence
Example 2: 94% Confidence STRONG SELL
📊 Market Conditions:
├─ Coin: ETH/USDT
├─ Price: $3,580
├─ Time: New York Session

📈 Technical Analysis:

1️⃣ RSI = 78 (Overbought) → SELL +15
2️⃣ MACD = Bearish Crossover → SELL +15
3️⃣ Bollinger = Upper Band → SELL +10
4️⃣ Fibonacci = 0.618 Resistance → SELL +10
5️⃣ Stochastic RSI = 85 → SELL +10
6️⃣ OBV = Falling 12% → SELL +5
7️⃣ Ichimoku = Price below Cloud → SELL +10

📊 Pattern Detection:
├─ Shooting Star (1h) → SELL +5
├─ Bearish Engulfing (15m) → SELL +5
├─ Evening Star (5m) → SELL +5
├─ Gravestone Doji (30m) → SELL +5
└─ Three Black Crows (1h) → SELL +5

💰 Volume Analysis:
├─ 24h Volume: $1.8B (1.5x average) → +5
├─ Selling Volume: 72% → +3
└─ Volume Spike on Red Candle → +2

🎯 Support/Resistance:
├─ Price at major resistance ($3,600) → +10
└─ 0.5% below resistance → Even better

🔄 Divergence:
├─ RSI Divergence Detected → +20
└─ Price Higher High, RSI Lower High → Extremely strong

━━━━━━━━━━━━━━━━━━━━━━━━━━━━━━━━━━━━━━━━━━━

📊 Score Calculation:

SELL Score = 15+15+10+10+10+5+10 + (5+5+5+5+5) + (5+3+2) + 10 + 20
           = 150

BUY Score = 0

Confidence = 50 + ((150 - 0) / 150 × 50) = 99.7%

🎯 Result: STRONG SELL with 99.7% Confidence
🔄 Confidence Update Process
Real-time Confidence Tracking:
Confidence Changes Over Time:

10:00 AM - Price $66,780
├─ RSI: 28 → BUY +15
├─ Confidence: 85%

10:05 AM - Price $66,820
├─ RSI: 32 → BUY +7 (decreased)
├─ Confidence: 78% (decreased)

10:10 AM - Price $66,750 (Back to support)
├─ RSI: 29 → BUY +15 (increased)
├─ Hammer Pattern → BUY +5
├─ Confidence: 91% (increased)

10:15 AM - Price $66,900
├─ RSI: 38 → BUY +7
├─ MACD Bearish Crossover → SELL +15
├─ Confidence: 65% (conflict)

→ System auto-updates the signal
→ Notifies trader that signal has changed
🎯 How to Identify Strong Signals
Visual Indicators:
| Signal Strength | Color | Icon | Audio | TP Levels |
|---|---|---|---|---|
| EXTREME (95%+) | Gold | 🔥🔥🔥 | Triple Beep | Up to TP4 |
| STRONG (85-94%) | Green | 🟢🟢 | Double Beep | Up to TP3 |
| GOOD (70-84%) | Light Green | 🟢 | Single Beep | Up to TP2 |
| WEAK (50-69%) | Yellow | 🟡 | None | Up to TP1 |
| AVOID (<50%) | Red | 🔴 | None | Don’t trade |
Text Indicators:
Signal Text Analysis:

"STRONG BUY" → 90%+ Confidence
"BUY" → 70-89% Confidence
"WEAK BUY" → 50-69% Confidence

"STRONG SELL" → 90%+ Confidence
"SELL" → 70-89% Confidence
"WEAK SELL" → 50-69% Confidence

"NEUTRAL" → 50% Confidence
💡 Practical Tips: Using Strong Signals
Tip 1: Multiple Confirmations
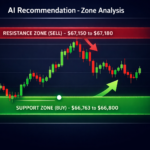
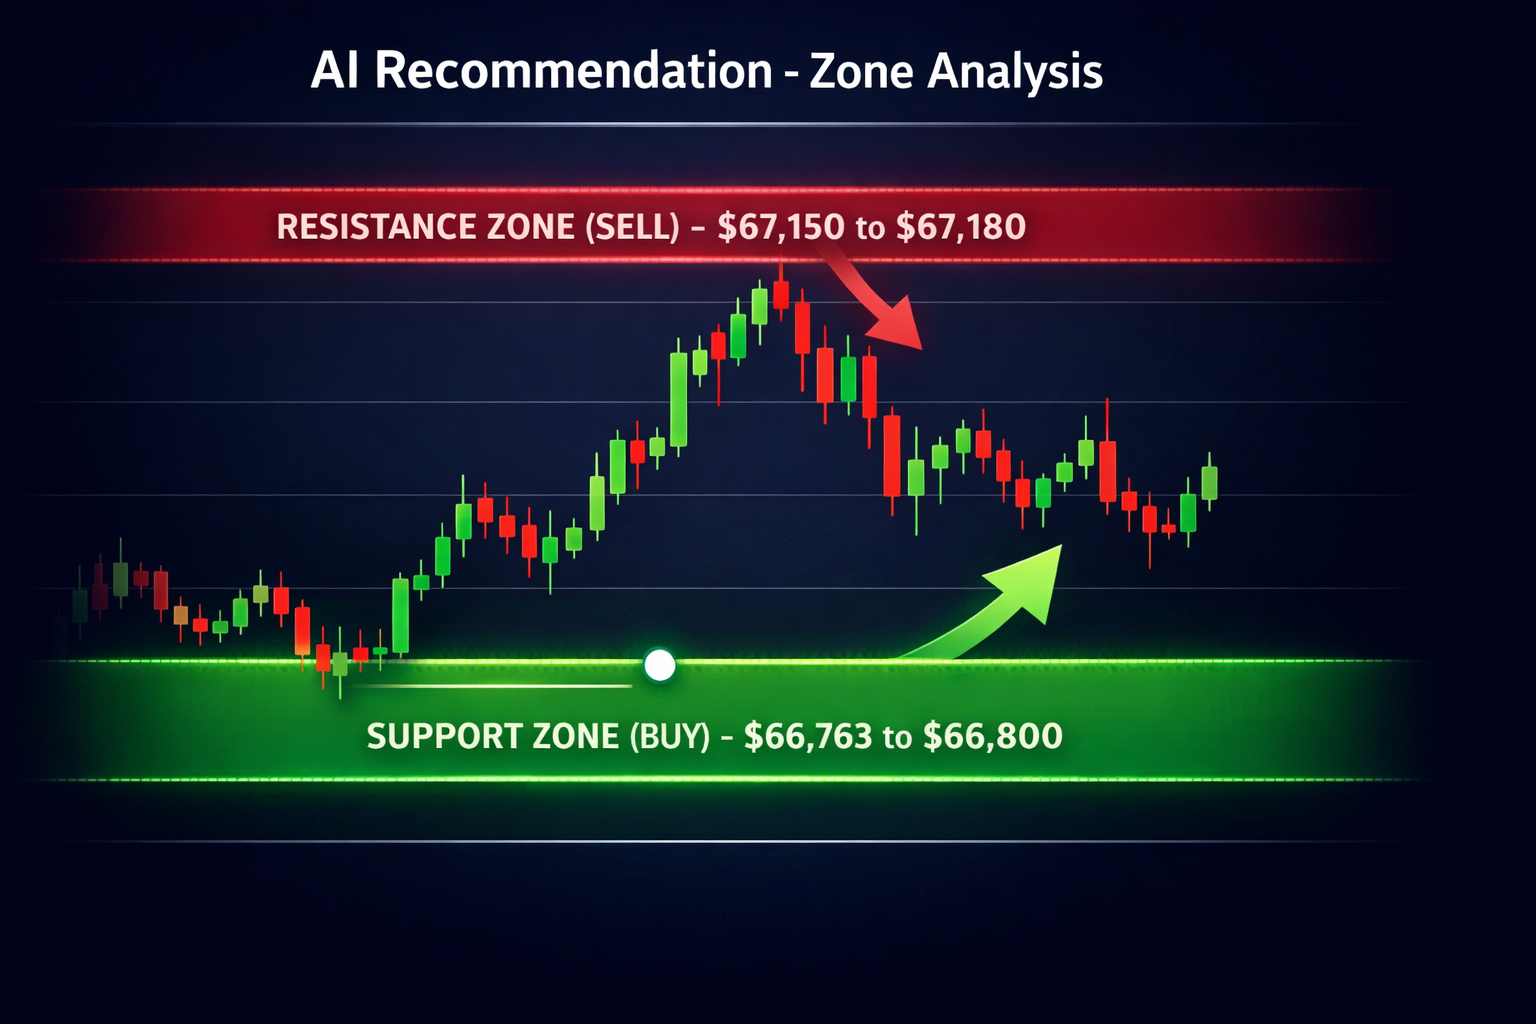
Confirm 3 things for a strong signal:

✅ AI Signal Confidence > 85%
✅ AI Recommendation Zone aligns (Support=BUY, Resistance=SELL)
✅ Multiple Timeframes (5m, 15m, 1h) all showing same direction

If all 3 align → Extremely strong setup
Tip 2: Volume Confirmation
Strong Signal + High Volume = Best Setup

For BUY Signals:
├─ Volume 1.5x above average
├─ Higher volume on green candles
└─ Lower volume on red candles

For SELL Signals:
├─ Volume 1.5x above average
├─ Higher volume on red candles
└─ Lower volume on green candles
Tip 3: News Avoidance
Signals are less reliable during important news:

30 minutes before and after high-impact news:
├─ Avoid trading signals
├─ Let market settle after news
└─ Then check signals again

Confidence decreases during news because:
├─ Indicators lag
├─ Volume spikes
└─ Price moves erratically
🏆 Successful Traders’ Strategies
Strategy 1: 90%+ Confidence + Support/Resistance
Setup:
├─ 90%+ Confidence BUY Signal
├─ Price at Major Support
└─ Volume Confirmation

Trade Plan:
├─ Position Size: Large (10-15% of balance)
├─ Leverage: 5-10X
├─ TP: Up to TP3
├─ SL: 0.5% below support
└─ Result: 80%+ Win Rate
Strategy 2: Divergence + Pattern
Setup:
├─ RSI Divergence Detected
├─ Reversal Pattern (Hammer/Shooting Star)
└─ 85%+ Confidence

Trade Plan:
├─ Position Size: Medium (5-8% of balance)
├─ Leverage: 3-5X
├─ TP: TP2-TP3
├─ SL: Opposite side of pattern
└─ Result: 75%+ Win Rate
Strategy 3: Multiple Timeframe Confirmation
Setup:
├─ 1h Chart: BUY Signal (75% Confidence)
├─ 15m Chart: BUY Signal (85% Confidence)
├─ 5m Chart: BUY Signal (90% Confidence)

Trade Plan:
├─ Position Size: Medium (5-8% of balance)
├─ Leverage: 3-5X
├─ TP: Small timeframe TP1, Large timeframe TP2
├─ SL: Below large timeframe support
└─ Result: 70%+ Win Rate
📝 Strong Signal Checklist
Check These 10 Points Before Trading:
☐ 1. Confidence above 80%?
☐ 2. Aligns with Recommendation Zone?
☐ 3. Multiple timeframes confirm?
☐ 4. Volume above average?
☐ 5. Any divergence present?
☐ 6. Strong patterns present?
☐ 7. At support/resistance levels?
☐ 8. No important news?
☐ 9. Good market session volume?
☐ 10. Funding rate/OI confirms?

If 8-10 match → Extremely strong signal
If 6-7 match → Good signal, trade cautiously
If less than 5 match → Don't trade
🎯 Summary
How AI Signal Confidence Generates Strong Signals:
-
Multi-Indicator Convergence – 10+ indicators working together
-
Weighted Scoring – Each indicator has different importance
-
Timeframe Harmony – Multiple timeframe confirmation
-
Real-time Adaptation – Updates every 5 seconds
-
Pattern Recognition – 15+ candlestick patterns
-
Divergence Detection – Trend reversal signals
-
Volume Analysis – Confirms signal strength
Remember:
-
90%+ Confidence = Extremely strong signal (TP3-TP4)
-
80-89% Confidence = Strong signal (TP2-TP3)
-
70-79% Confidence = Good signal (TP1-TP2)
-
Below 70% = Don’t trade or very small trade
Final Word:
AI Signal Confidence is a powerful tool, but it’s not 100% perfect. Always use risk management, set stop losses, and never risk your entire balance on a single trade.
Proper Usage = Recommendation + Signal + Confidence + Risk Management = Successful Trading! 🚀📈