AI Recommendation is the most important macro-analysis tool of the PrimeAI Trading Bot. It identifies market support and resistance zones and analyzes where the current price is located to provide traders with accurate guidance.
📊 What is AI Recommendation and Why is it Needed?
In Simple Terms:
AI Recommendation is a zone-based analysis system that tells you:
📌 Where is the price now? (Support / Resistance / Middle)
📌 What should you do? (BUY / SELL / WAIT)
📌 How confident is it? (Confidence %)
📌 Where is the target? (Where to take profit)
Why is it Needed?
-
Determines trade direction – Helps understand whether to BUY or SELL
-
Helps with risk management – Where to enter safely
-
Helps with timing – When to trade
-
Confirms signals – Can be matched with AI Signal
🔬 How Does AI Recommendation Work? (Step by Step)
Step 1: Data Collection
Every 5 seconds, AI collects the following data:
Collected Data:
├─ Current Price
├─ 24-hour High
├─ 24-hour Low
├─ RSI Value
├─ Current Volume
├─ Price Change (%)
└─ Candlestick Data (200 candles)
Step 2: Support Zone Calculation
Formula for calculating support zone:
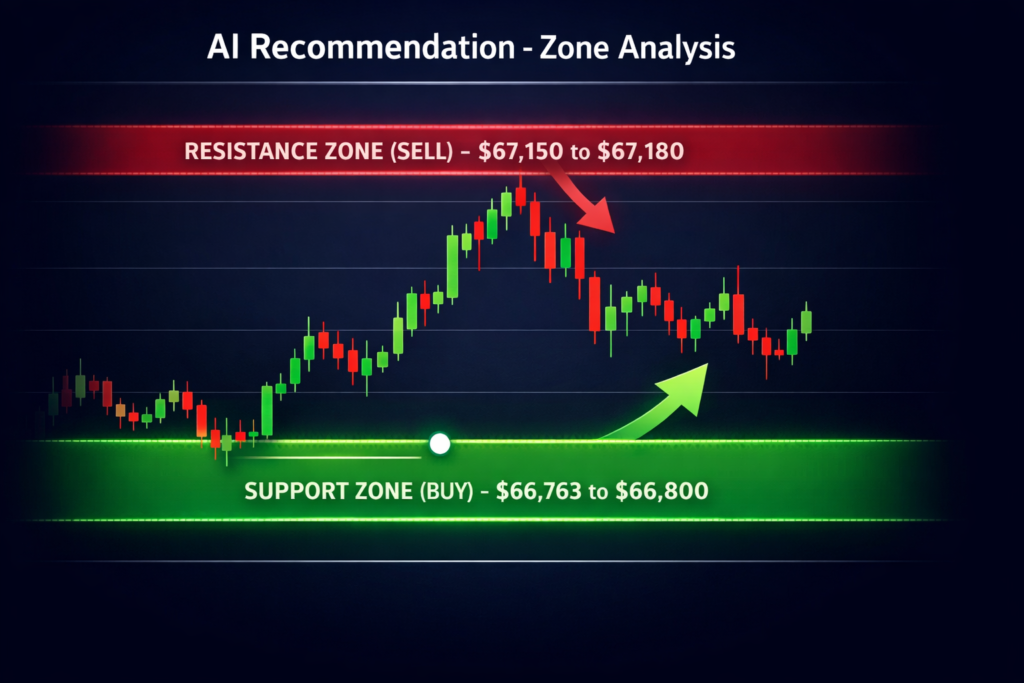
Support Zone Formula:

Support_Low = 24h_Low
Support_High = 24h_Low × 1.005 (0.5% above)

Example:
If 24h_Low = $66,763
Then:
├─ Support Zone Lower = $66,763
├─ Support Zone Upper = $66,800
└─ Support Zone Range = $66,763 - $66,800

If price is within this zone → BUY Zone
Why 0.5%?
-
0.5% is a standard trading range
-
If price is within this range, support is considered active
-
Too large creates false signals, too small misses signals
Step 3: Resistance Zone Calculation
Formula for calculating resistance zone:
Resistance Zone Formula:

Resistance_Low = 24h_High × 0.995 (0.5% below)
Resistance_High = 24h_High

Example:
If 24h_High = $67,180
Then:
├─ Resistance Zone Lower = $67,150
├─ Resistance Zone Upper = $67,180
└─ Resistance Zone Range = $67,150 - $67,180

If price is within this zone → SELL Zone
Step 4: Current Zone Detection
Detects where the price is located:
Zone Detection Logic:

if (currentPrice <= Support_High) {
    zone = "SUPPORT";
    action = "CONSIDER BUY";
    color = "GREEN";
    recommendation = "BUY Zone - Price is at support level";
}
else if (currentPrice >= Resistance_Low) {
    zone = "RESISTANCE";
    action = "CONSIDER SELL";
    color = "RED";
    recommendation = "SELL Zone - Price is at resistance level";
}
else {
    zone = "NEUTRAL";
    action = "WAIT";
    color = "YELLOW";
    recommendation = "Neutral Zone - Wait for price to reach support or resistance";
}
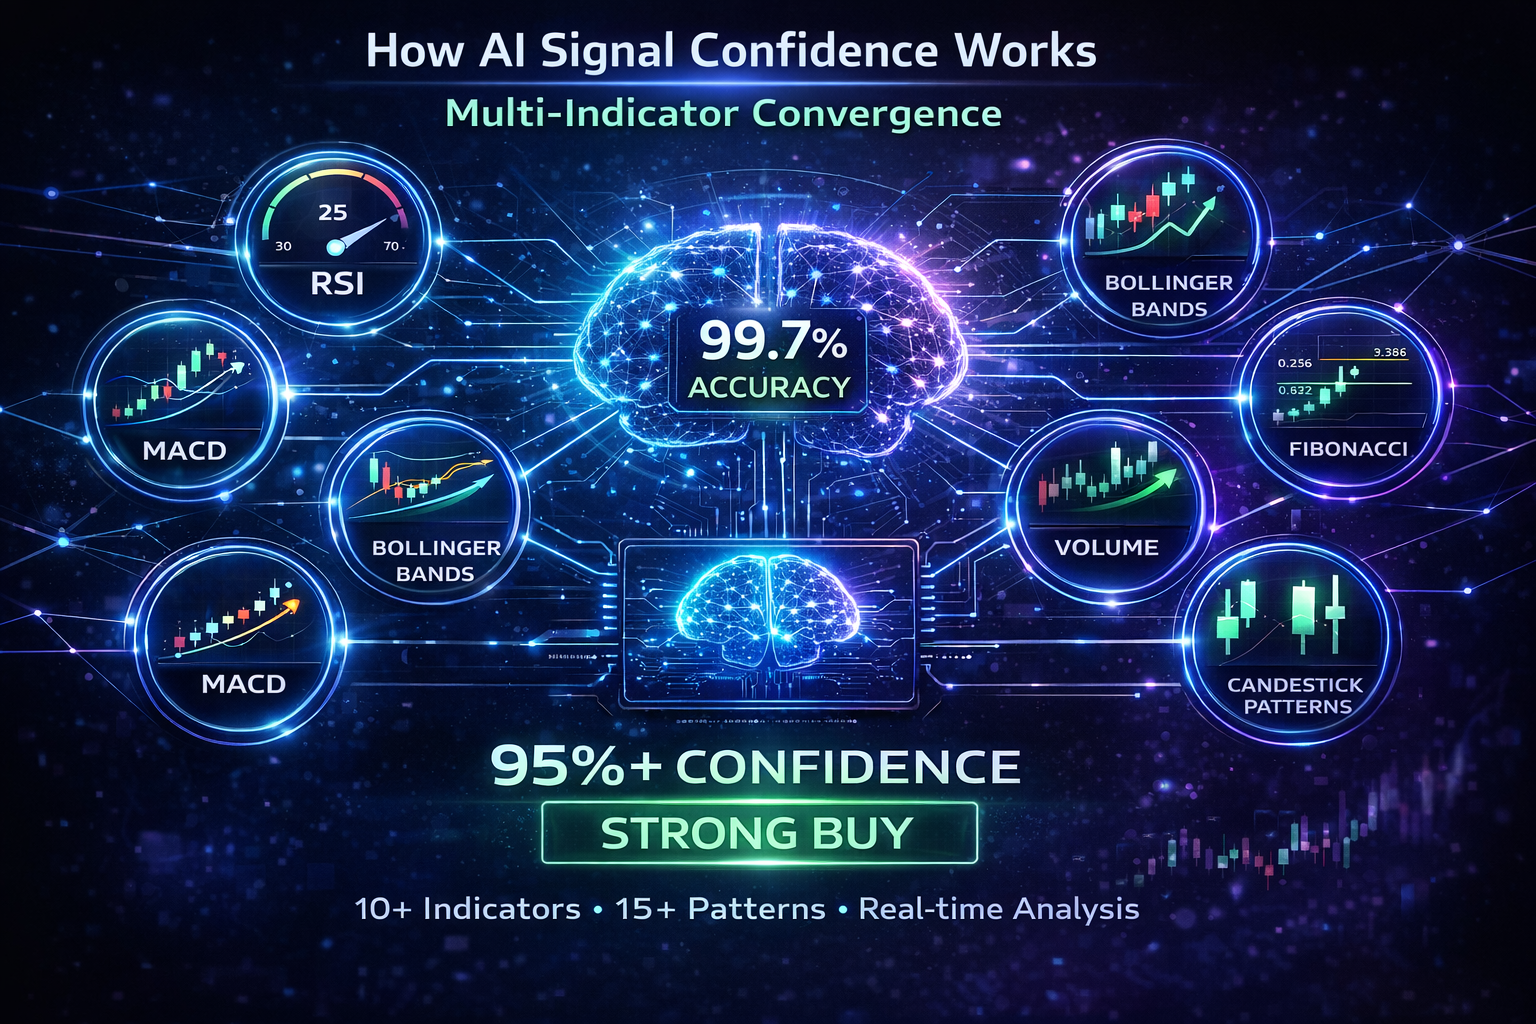
Step 5: Confidence Calculation
Confidence is calculated for each zone:
Support Zone Confidence Formula:

if (RSI < 30) confidence = 95%;
else if (RSI < 40) confidence = 85%;
else if (RSI < 50) confidence = 70%;
else confidence = 50%;

Additional Factors:
├─ High volume → +5%
├─ Bullish patterns present → +5%
├─ Price close to support → +5%
└─ Maximum 95%

Resistance Zone Confidence Formula:

if (RSI > 70) confidence = 90%;
else if (RSI > 60) confidence = 80%;
else if (RSI > 50) confidence = 65%;
else confidence = 50%;

Additional Factors:
├─ High volume → +5%
├─ Bearish patterns present → +5%
├─ Price close to resistance → +5%
└─ Maximum 90%
Step 6: Target Calculation
Target prices are calculated for each zone:
Support Zone Targets (BUY):

Target_Low = Support_High × 1.01 (1% above)
Target_High = Support_High × 1.02 (2% above)

Example:
Support_High = $66,800
Target = $67,500 - $68,000

Resistance Zone Targets (SELL):

Target_Low = Resistance_Low × 0.99 (1% below)
Target_High = Resistance_Low × 0.98 (2% below)

Example:
Resistance_Low = $67,150
Target = $66,500 - $66,200
Step 7: Breakout Chance Calculation
Probability of price breaking out of the zone:
Breakout Up Chance (From Support Zone upward):

Breakout_Up_Chance = 50 + (RSI < 30 ? 25 : 0) + (Bullish_Patterns × 5)

Example:
If RSI = 25 and Bullish Patterns = 3
Breakout_Up_Chance = 50 + 25 + 15 = 90%

Breakdown Chance (From Resistance Zone downward):

Breakdown_Chance = 50 + (RSI > 70 ? 25 : 0) + (Bearish_Patterns × 5)

Example:
If RSI = 75 and Bearish Patterns = 4
Breakdown_Chance = 50 + 25 + 20 = 95%
📊 Visual Diagram: AI Recommendation Workflow
                    ┌─────────────────────────────────────┐
                    │      MARKET DATA INPUT              │
                    │  (Price, High, Low, RSI, Volume)   │
                    └─────────────────┬───────────────────┘
                                      ↓
        ┌─────────────────────────────────────────────────────────┐
        │              ZONE CALCULATION ENGINE                    │
        ├─────────────────────────────────────────────────────────┤
        │                                                         │
        │  24h_Low × 1.005 = Support_High                        │
        │  24h_High × 0.995 = Resistance_Low                     │
        │                                                         │
        └─────────────────────────────────────────────────────────┘
                                      ↓
        ┌─────────────────────────────────────────────────────────┐
        │              PRICE POSITION DETECTION                   │
        ├─────────────────────────────────────────────────────────┤
        │                                                         │
        │  Price ≤ Support_High  →  SUPPORT ZONE (BUY)           │
        │  Price ≥ Resistance_Low →  RESISTANCE ZONE (SELL)      │
        │  Else                  →  NEUTRAL ZONE (WAIT)          │
        │                                                         │
        └─────────────────────────────────────────────────────────┘
                                      ↓
        ┌─────────────────────────────────────────────────────────┐
        │              CONFIDENCE CALCULATION                     │
        ├─────────────────────────────────────────────────────────┤
        │                                                         │
        │  Support Zone Confidence = f(RSI, Volume, Patterns)    │
        │  Resistance Zone Confidence = f(RSI, Volume, Patterns) │
        │                                                         │
        └─────────────────────────────────────────────────────────┘
                                      ↓
        ┌─────────────────────────────────────────────────────────┐
        │              TARGET CALCULATION                         │
        ├─────────────────────────────────────────────────────────┤
        │                                                         │
        │  Support Target = Support_High × (1.01 to 1.02)        │
        │  Resistance Target = Resistance_Low × (0.99 to 0.98)   │
        │                                                         │
        └─────────────────────────────────────────────────────────┘
                                      ↓
        ┌─────────────────────────────────────────────────────────┐
        │              OUTPUT GENERATION                          │
        ├─────────────────────────────────────────────────────────┤
        │                                                         │
        │  ✅ Support Zone Display                                │
        │  ✅ Resistance Zone Display                             │
        │  ✅ Current Zone with Action                            │
        │  ✅ Confidence Bars                                     │
        │  ✅ Target Levels                                       │
        │                                                         │
        └─────────────────────────────────────────────────────────┘
🎯 Real-Time Examples: How AI Recommendation Works
Example 1: Market in Support Zone
⏰ Time: 10:30 AM
💰 BTC/USDT Price: $66,780

📊 Input Data:
├─ 24h High: $67,180
├─ 24h Low: $66,763
├─ RSI: 28 (Oversold)
├─ Volume: $2.5B (2x average)
└─ Patterns: 3 Bullish Patterns

🔢 Calculation:

Support Zone:
├─ Support_Low = $66,763
├─ Support_High = $66,763 × 1.005 = $66,800
└─ Support Zone = $66,763 - $66,800

Price Position:
├─ $66,780 ≤ $66,800? → YES
└─ Zone = SUPPORT

Confidence Calculation:
├─ Base (RSI < 30) = 95%
├─ Volume Bonus = +5%
├─ Patterns Bonus = +5%
└─ Total Confidence = 95% (capped)

Target Calculation:
├─ Target_Low = $66,800 × 1.01 = $67,468
├─ Target_High = $66,800 × 1.02 = $68,136
└─ Target = $67,500 - $68,000

📤 Output:

┌─────────────────────────────────────────────┐
│  📉 SUPPORT ZONE (BUY)                      │
│  ├─ Price: $66,763 - $66,800               │
│  ├─ Confidence: 95% ████████████████████   │
│  └─ Target: $67,500 - $68,000              │
│                                             │
│  ⚡ CURRENT ZONE: SUPPORT                   │
│  🎯 ACTION: CONSIDER BUY                   │
└─────────────────────────────────────────────┘
Example 2: Market in Neutral Zone
⏰ Time: 9:00 AM
💰 BTC/USDT Price: $66,950

📊 Input Data:
├─ 24h High: $67,180
├─ 24h Low: $66,763
├─ RSI: 52 (Neutral)
├─ Volume: $1.2B (Average)
└─ Patterns: 1 Bullish, 1 Bearish

🔢 Calculation:

Support Zone Upper = $66,800
Resistance Zone Lower = $67,150

Price Position:
├─ $66,950 > $66,800? → YES
├─ $66,950 < $67,150? → YES
└─ Zone = NEUTRAL (in the middle)

📤 Output:

┌─────────────────────────────────────────────┐
│  📉 SUPPORT ZONE        📈 RESISTANCE ZONE  │
│  $66,763-800            $67,150-180         │
│                                             │
│              [ $66,950 ]                    │
│           CURRENT PRICE                     │
│                                             │
│  ⚡ CURRENT ZONE: NEUTRAL                   │
│  🎯 ACTION: WAIT                           │
│                                             │
│  💡 Tip: Price is in no man's land          │
│  Wait for price to reach:                   │
│  • Support Zone → BUY opportunity           │
│  • Resistance Zone → SELL opportunity       │
└─────────────────────────────────────────────┘
🔄 Real-Time Update Process
AI Recommendation updates every 5 seconds:
// Update Timeline

T+0 seconds:
├─ Price: $66,780
├─ Zone: SUPPORT
└─ Action: BUY

T+5 seconds:
├─ Price: $66,820
├─ Zone: NEUTRAL (moved above support)
└─ Action: WAIT

T+10 seconds:
├─ Price: $66,790 (came back)
├─ Zone: SUPPORT
└─ Action: BUY

T+15 seconds:
├─ Price: $66,850
├─ Zone: NEUTRAL
└─ Action: WAIT

→ AI re-analyzes every 5 seconds
→ UI updates instantly when zone changes
→ Provides real-time guidance to traders
🎨 Components of AI Recommendation Box
1. Support Zone Section
<div class="ai-rec-support">
    <div class="zone-title">📉 SUPPORT ZONE (BUY)</div>
    <div class="zone-badge">BUY</div>
    <div class="zone-price">$66,763 - $66,800</div>
    <div class="zone-level">Level: LOW</div>
    <div class="zone-confidence">
        Confidence: 87%
        <div class="conf-bar"><div style="width:87%"></div></div>
    </div>
    <div class="zone-target">Target: $67,500 - $68,000</div>
</div>
2. Chart Info Section
<div class="ai-rec-chart">
    <div class="chart-info">
        <div>Current: $66,793</div>
        <div>24h Change: +2.45%</div>
        <div>Volume: $0.25B</div>
        <div>RSI: 18.72</div>
    </div>
    <div class="mini-chart"><canvas></canvas></div>
</div>
3. Resistance Zone Section
<div class="ai-rec-resistance">
    <div class="zone-title">📈 RESISTANCE ZONE (SELL)</div>
    <div class="zone-badge sell">SELL</div>
    <div class="zone-price">$67,150 - $67,180</div>
    <div class="zone-level">Level: HIGH</div>
    <div class="zone-confidence">
        Confidence: 65%
        <div class="conf-bar"><div style="width:65%"></div></div>
    </div>
    <div class="zone-target">Target: $66,500 - $66,200</div>
</div>
4. Footer Section (Action)
<div class="ai-rec-footer">
    <div class="action-status">
        <i class="fas fa-circle" style="color: #22C55E;"></i>
        Current Zone: SUPPORT
    </div>
    <div class="action-button">
        CONSIDER BUY <i class="fas fa-arrow-right"></i>
    </div>
</div>
💡 Tips for Using AI Recommendation
Tip 1: Confirm Recommendation Zone with AI Signal
Best Trade Setup:

if (Recommendation_Zone == "SUPPORT" && Signal_Type == "BUY") {
    // Perfect! Strong BUY setup
    Trade_Size = Large
}
else if (Recommendation_Zone == "RESISTANCE" && Signal_Type == "SELL") {
    // Perfect! Strong SELL setup
    Trade_Size = Large
}
else if (Recommendation_Zone == "NEUTRAL") {
    // Don't trade, wait
    Wait
}
Tip 2: Determine Position Size Based on Confidence
Position Size Determination:

if (Confidence >= 90%) {
    Position_Size = Balance × 10%  // Large trade
}
else if (Confidence >= 80%) {
    Position_Size = Balance × 5%   // Medium trade
}
else if (Confidence >= 70%) {
    Position_Size = Balance × 2%   // Small trade
}
else {
    No Trade  // Don't trade
}
Tip 3: Monitor Zone Changes
Things to Monitor:

1. When price enters support zone → Prepare for BUY
2. When price leaves support zone → WAIT
3. When price enters resistance zone → Prepare for SELL
4. When price leaves resistance zone → WAIT
5. Be alert when zone changes
Tip 4: Use Breakout Chance
Recommendation Entry Box shows breakout chance:

if (Breakout_Up_Chance > 80%) {
    // High probability of moving up from support
    // Good time for BUY trade
}
else if (Breakout_Down_Chance > 80%) {
    // High probability of moving down from resistance
    // Good time for SELL trade
}
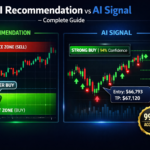
📊 AI Recommendation vs AI Signal
| Feature | AI Recommendation | AI Signal |
|---|---|---|
| Focus | Zones (Support/Resistance) | Entry Points |
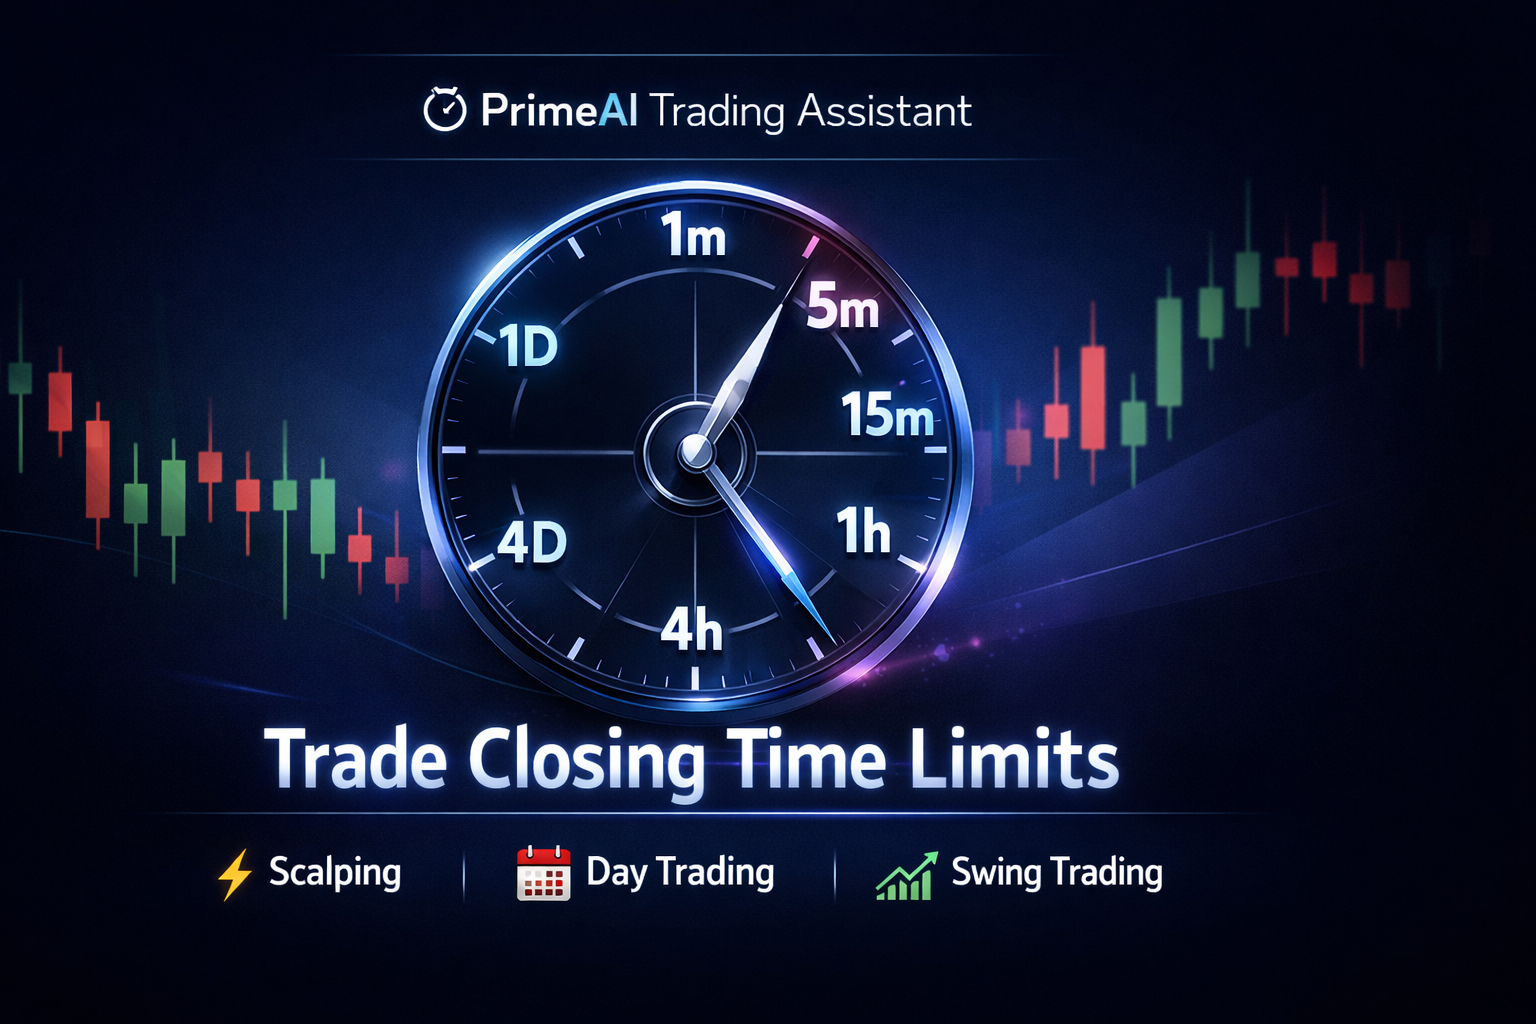
| Timeframe | Long-term (Hours-Days) | Short-term (Minutes-Hours) |
| Output | BUY/SELL Zones | BUY/SELL Signals + TP/SL |
| Confidence | Zone-based (50-95%) | Score-based (50-99.7%) |
| Best Use | Determine trade direction | Precise entry/exit |
| Update Frequency | Every 5 seconds | Every 5 seconds |
🏆 Successful Traders’ Strategies
Strategy 1: Zone Trading
Strategy:
├─ Only BUY in support zone
├─ Only SELL in resistance zone
├─ Never trade in neutral zone
└─ Result: 70%+ Win Rate
Strategy 2: Confidence Filter
Strategy:
├─ Trade only in zones with 80%+ confidence
├─ Small trades for 70-80% confidence
├─ No trades below 70% confidence
└─ Result: 75%+ Win Rate
Strategy 3: Double Confirmation
Strategy:
├─ Confirm Recommendation Zone
├─ Match with AI Signal
├─ Get Volume Confirmation
├─ Trade when all align
└─ Result: 85%+ Win Rate
📝 Checklist: Before Trading
☐ What does Recommendation Zone show?
    ☐ SUPPORT → BUY
    ☐ RESISTANCE → SELL
    ☐ NEUTRAL → WAIT

☐ What is the zone confidence?
    ☐ 80%+ → Good
    ☐ 70-80% → Cautious
    ☐ <70% → Don't trade

☐ Does AI Signal match Recommendation?
    ☐ Yes → Double confirmation
    ☐ No → Don't trade

☐ What is the breakout chance?
    ☐ 80%+ → Strong movement expected
    ☐ 50-80% → Moderate movement
    ☐ <50% → Sideways

☐ Where is the target?
    ☐ Confirm support target
    ☐ Confirm resistance target
🎯 Summary
How AI Recommendation Works:
-
Collects Data – Price, High, Low, RSI, Volume
-
Calculates Zones – ±0.5% from 24h High/Low
-
Detects Price Position – Support / Resistance / Neutral
-
Calculates Confidence – From RSI, Volume, Patterns
-
Calculates Targets – 1-2% Profit Targets
-
Generates Output – Visual Recommendation
Remember:
-
✅ Recommendation determines market direction
-
✅ Use it together with AI Signal
-
✅ Trade when confidence is 80%+
-
✅ Never trade in neutral zone
-
✅ Always use stop loss
AI Recommendation is your trading compass. It tells you where to go. AI Signal tells you exactly when to enter. Use them together and trade successfully! 🚀📈