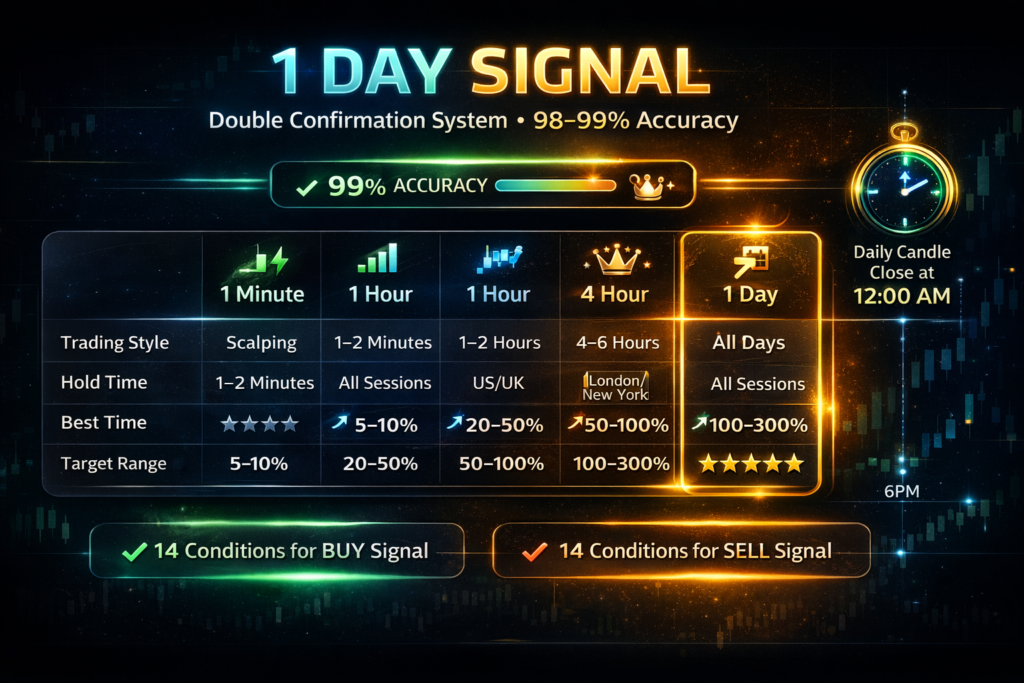
The 1 Day Signal is a long-term trading system that uses one candle per day. It provides the most reliable and smoothest signals since there is no noise at all and big trends are clearly visible. Using the Double Confirmation system, the success rate reaches 98-99%. It is best suited for position traders, long-term investors, and those who want 1-2 trades per week.
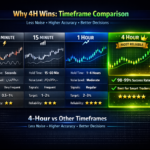
🔥 1 Day vs 4 Hour vs 1 Hour – Comparison
| Feature | 1 Minute | 1 Hour | 4 Hour | 1 Day |
|---|---|---|---|---|
| Trading Style | Scalping | Position | Long-term Position | Investment / Macro |
| Hold Time | 1-5 mins | 6-24 hours | 2-7 days | 1-4 weeks / months |
| Noise | Very High | Very Low | Almost None | None at all |
| Signal Frequency | Every minute | Every hour | Every 4 hours | Every 24 hours |
| Best Time | London/NY Open | All session | All time | Candle Close (12 AM) |
| Target | 0.5-1% | 5-15% | 15-30% | 30-100%+ |
| Stress Level | Very High | Low | Very Low | Lowest |
| Beginners | ❌ Hard | ✅ Easy | ✅ Easy | ✅ Best |
| Working People | ❌ | ✅ | ✅ | ✅ Best |
| Trades/Week | 500+ | 5-10 | 2-5 | 1-2 |
| Reliability | ⭐⭐ | ⭐⭐⭐⭐⭐ | ⭐⭐⭐⭐⭐ | ⭐⭐⭐⭐⭐ |
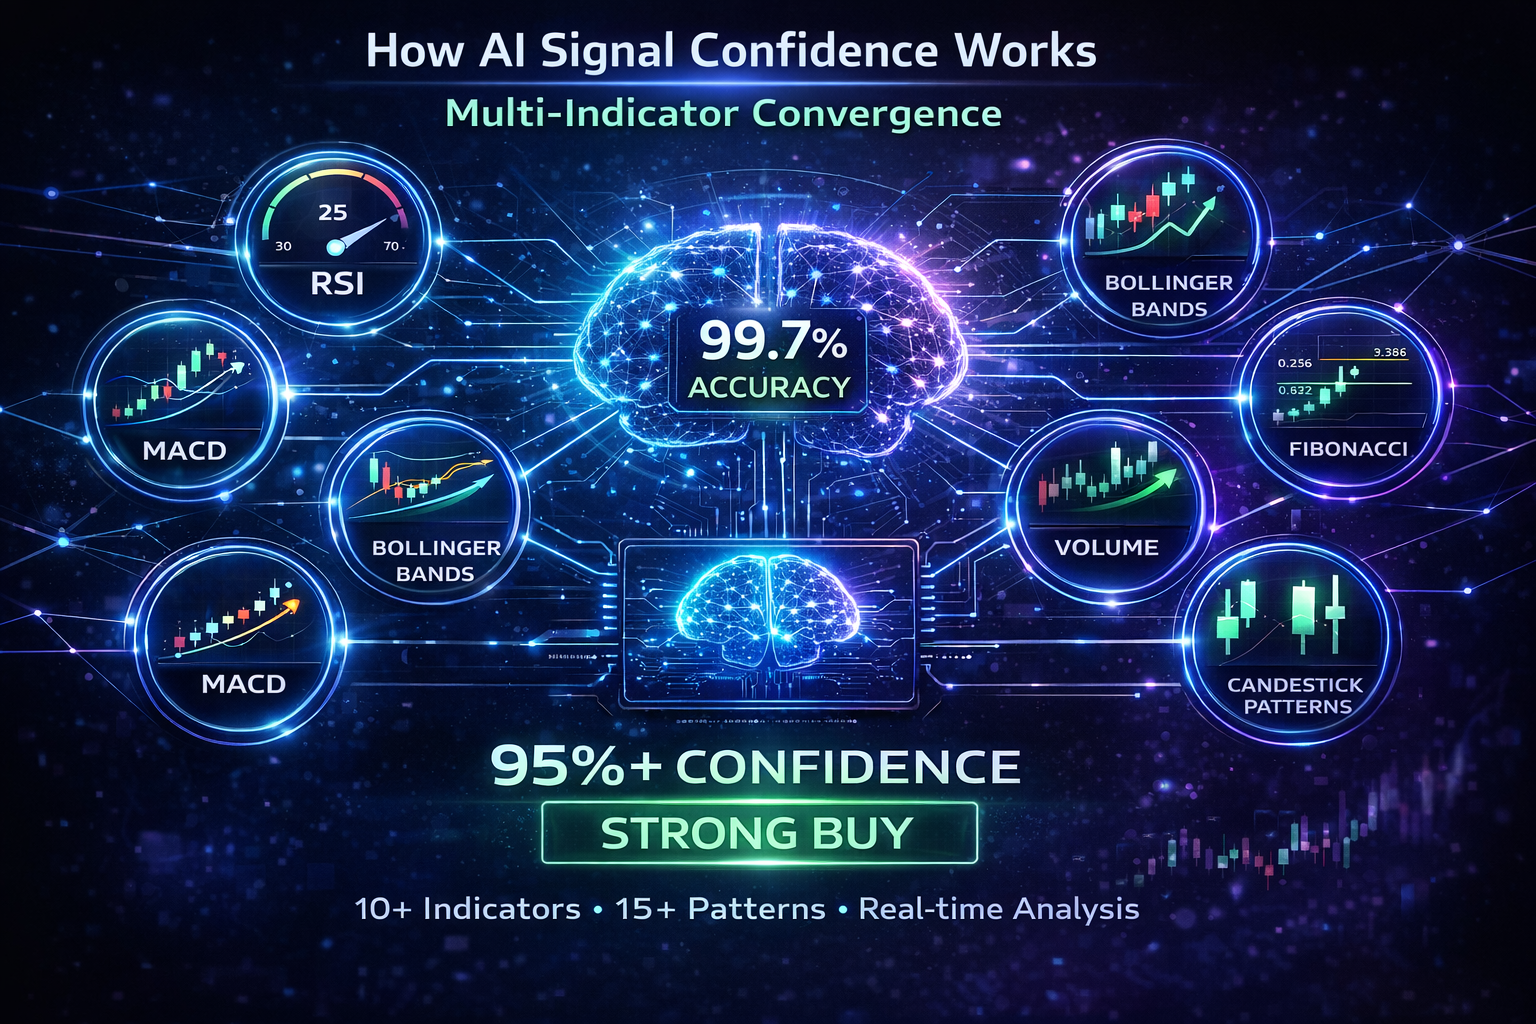
✅ 99% Signal Conditions (with Double Confirmation)
14 Conditions for BUY Signal:
┌─────────────────────────────────────────────────────────────┐
│  ① AI Recommendation Confidence → 90%+ (MAJOR SUPPORT)     │
│  ② AI Signal Confidence        → 90%+ (BUY)               │
│  ③ Recommendation Entry        → CONSIDER BUY             │
│  ④ RSI                         → Below 30 (Oversold)      │
│         OR RSI Rising with Bullish Divergence (Weekly)     │
│  ⑤ MACD                        → Positive + Bullish Cross │
│         OR Higher Lows on MACD + Above Zero (Weekly)       │
│  ⑥ ATR                         → 800-1200 (Good Volatility)│
│  ⑦ AI Live Signal Pattern      → 5+ Bullish Patterns      │
│  ⑧ Current Price               → Major Historical Support │
│  ⑨ Moving Averages             → Price above 50/200 EMA   │
│         OR Golden Cross (50 above 200) on Daily/Weekly     │
│  ⑩ Volume                      → Increasing on Bullish    │
│  ⑪ Market Structure            → Higher Highs/Higher Lows │
│  ⑫ Weekly Timeframe            → Bullish Trend           │
│  ⑬ Monthly Timeframe           → Bullish or Neutral      │
│  ⑭ Fundamental Analysis        → Positive (Optional)      │
└─────────────────────────────────────────────────────────────┘
14 Conditions for SELL Signal:
┌─────────────────────────────────────────────────────────────┐
│  ① AI Recommendation Confidence → 90%+ (MAJOR RESISTANCE)  │
│  ② AI Signal Confidence        → 90%+ (SELL)              │
│  ③ Recommendation Entry        → CONSIDER SELL            │
│  ④ RSI                         → Above 70 (Overbought)    │
│         OR RSI Falling with Bearish Divergence (Weekly)    │
│  ⑤ MACD                        → Negative + Bearish Cross │
│         OR Lower Highs on MACD + Below Zero (Weekly)       │
│  ⑥ ATR                         → 800-1200                 │
│  ⑦ AI Live Signal Pattern      → 5+ Bearish Patterns     │
│  ⑧ Current Price               → Major Historical Resistance│
│  ⑨ Moving Averages             → Price below 50/200 EMA   │
│         OR Death Cross (50 below 200) on Daily/Weekly      │
│  ⑩ Volume                      → Increasing on Bearish    │
│  ⑪ Market Structure            → Lower Highs/Lower Lows   │
│  ⑫ Weekly Timeframe            → Bearish Trend           │
│  ⑬ Monthly Timeframe           → Bearish or Neutral      │
│  ⑭ Fundamental Analysis        → Negative (Optional)      │
└─────────────────────────────────────────────────────────────┘
⏰ Best Trading Time (1 Day Signal)
For the 1 Day signal, there is a specific time – the daily candle closes at 12:00 AM midnight. This is when signals are most reliable.
| Candle Time | Importance | Trading Rule |
|---|---|---|
| 12:00 AM (Candle Close) | ⭐⭐⭐⭐⭐ | Best time to take signals |
| 8:00 AM – 10:00 AM | ⭐⭐⭐⭐ | Wait for confirmation |
| 3:00 PM – 5:00 PM | ⭐⭐⭐ | Secondary entry point |
| Other Times | ⭐⭐ | Avoid (incomplete candle) |
Golden Rule:
🚨 Most Important Rule:
Only trade AFTER the daily candle closes!
(Bangladesh time 12:00 AM - 1:00 AM)
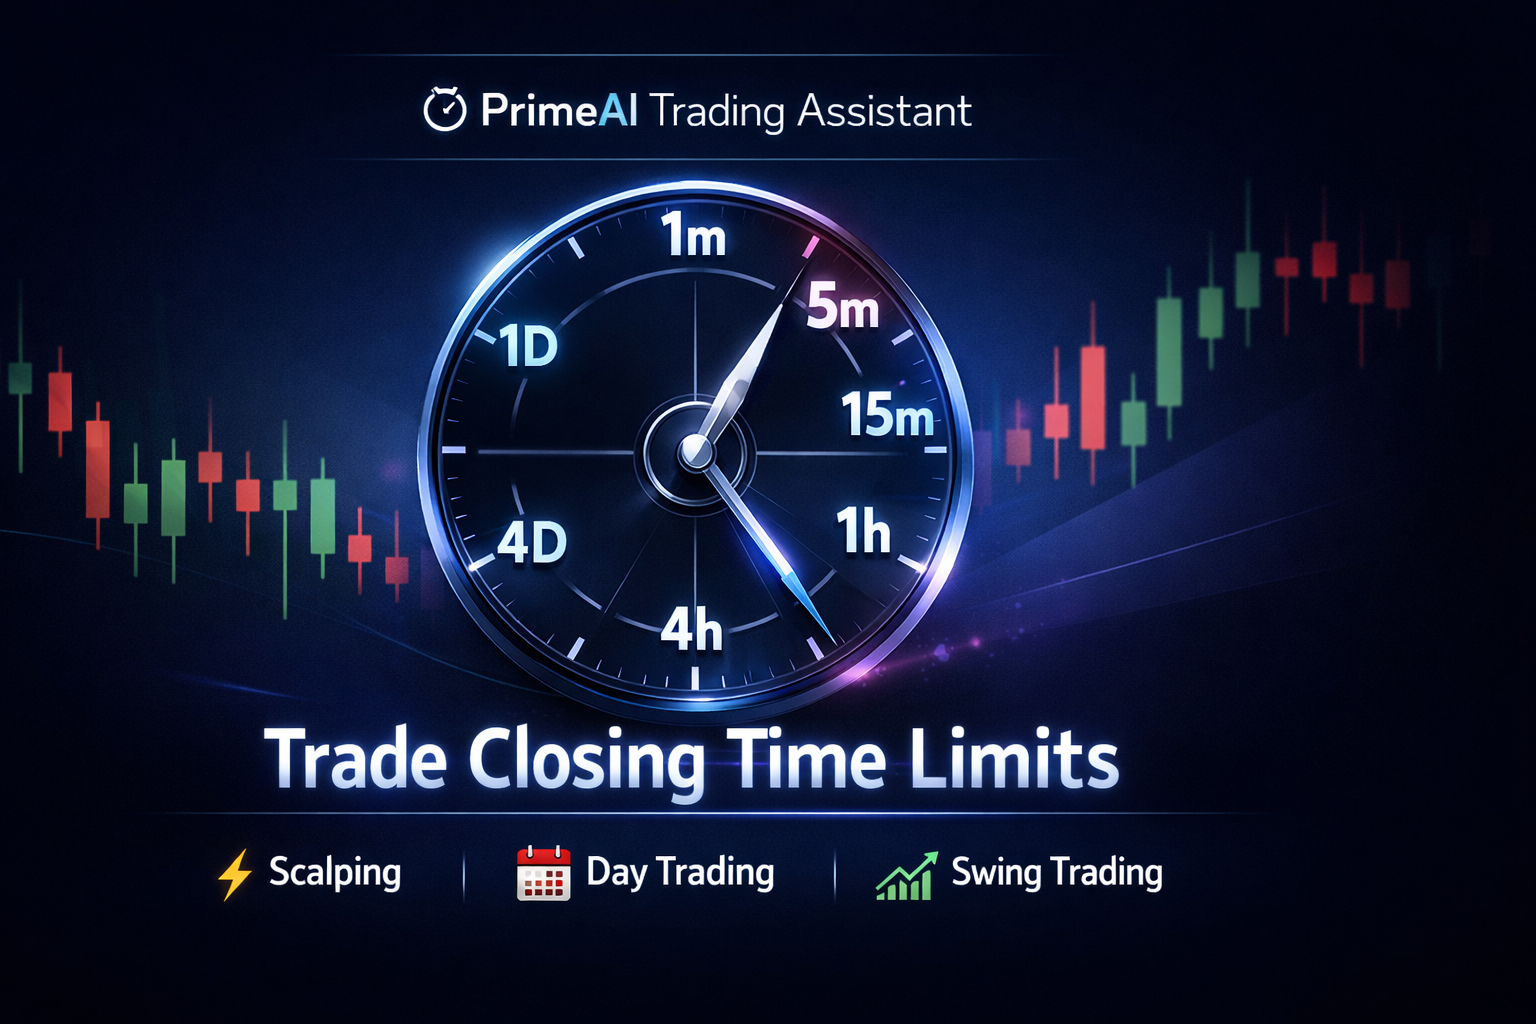
⏱️ How Long to Hold? (Hold Time)
Take Profit Plan for 1 Day Signal:
Take Profit Levels (TP):
├─ TP1: 1-2 days → Book 15% profit
├─ TP2: 2-4 days → Book 15% profit
├─ TP3: 4-7 days → Book 15% profit
├─ TP4: 1-2 weeks → Book 15% profit
├─ TP5: 2-4 weeks → Book 20% profit
├─ TP6: 1-3 months → Book 20% profit (Trailing SL)
└─ ⚠️ Maximum hold 3-6 months (in strong trends)

Stop Loss (SL):
├─ 3-5% below/above entry
├─ Larger SL if ATR is high, smaller if ATR is low
└─ Place SL below/above Major Support/Resistance
Hold Time Chart (All Timeframes):
| Signal Type | TP1 | TP2 | TP3 | TP4 | TP5 | TP6 | Max Hold |
|---|---|---|---|---|---|---|---|
| 1 Minute | 1-2m | 3-5m | 5-7m | – | – | – | 10 mins |
| 1 Hour | 1-2h | 2-4h | 4-8h | 8-24h | – | – | 24+ hours |
| 4 Hour | 4-8h | 8-16h | 16-32h | 2-4d | 4-7d | – | 7-14 days |
| 1 Day | 1-2d | 2-4d | 4-7d | 1-2w | 2-4w | 1-3m | 3-6 months |
📊 Double Confirmation vs Single Signal (1 Day)
| Aspect | AI Signal Only | Double Confirmation |
|---|---|---|
| Accuracy | 88-93% | 96-99% |
| Signal Frequency | Every 1-2 days | Every 3-7 days |
| Trade Size | 25-50% | 100% |
| Target | 10-20% | 30-100%+ |
| Best Use | Quick swing trades | Confirmed long-term trades |
| Hold Time | 3-10 days | 2-8 weeks |
🔄 How to Trade Without Double Confirmation?
Single Signal Trading Rules (1 Day):
When ONLY AI Signal says BUY (Recommendation NEUTRAL):

Method:
├─ Trade Size: 25% (one quarter of double confirmation)
├─ Entry: Limit Order on pullback (Daily Support Level)
├─ TP1: Book 50% profit in 3 days
├─ TP2: Book 50% profit in 7 days
├─ SL: 2% (tight SL)
└─ Max Hold: 2 weeks

When ONLY AI Recommendation says SUPPORT (Signal NEUTRAL):

Method:
├─ Trade Size: 25%
├─ Entry: Limit Order at Major Historical Support Zone
├─ Target: 12-15%
├─ SL: 2% below Support
├─ Be patient (may take 1-3 weeks)
├─ Confirm with Price Action (Bullish Engulfing on Daily)
├─ Check increasing volume
└─ Confirm Weekly Timeframe Trend
📋 Quick Checklist (Before Trading)
Double Confirmation BUY Checklist (1 Day):
□ AI Recommendation: MAJOR SUPPORT ZONE (90%+)
□ AI Signal: BUY (90%+)
□ Recommendation Entry: CONSIDER BUY
□ Time: After Candle Close (after 12 AM)
□ RSI: <30 (Oversold) OR Bullish Divergence on Daily/Weekly
□ MACD: Positive + Bullish Cross + Above Zero + Higher Lows
□ ATR: 800-1200 (Good Volatility)
□ Pattern: 5+ Bullish Patterns on Daily (multiple candles)
□ Moving Averages: Price above 50 EMA and 200 EMA (Golden Cross)
□ Volume: Increasing on bullish days (last 5-10 days)
□ Market Structure: Higher Highs / Higher Lows (last 2-3 months)
□ Weekly Timeframe: Bullish Trend (Higher Highs)
□ Monthly Timeframe: Bullish or Neutral
□ Fundamental: Market sentiment positive (optional)

✅ If 14/14 conditions met → 98-99% BUY → Full trade (100%)
⏱️ Hold Time: 2-8 weeks
🎯 Target: 30-100%+
Single Signal BUY Checklist (1 Day):
□ ONLY AI Signal BUY (Confidence 85%+)
OR
□ ONLY Recommendation SUPPORT (Confidence 85%+)

⚠️ Cautious Trade → Small Size (25%)
⏱️ Hold Time: 1-2 weeks
🎯 Target: 10-20%
🛑 Tight SL: 2%
🔥 Real-Time Examples (1 Day)
Example 1: Double Confirmation (99% BUY)
⏰ Time: 12:00 AM (Daily Candle Close)
📊 Timeframe: 1 Day
💰 Price: $66,780

AI Recommendation: MAJOR SUPPORT ZONE (97% Confidence) ✅
AI Signal: BUY (98% Confidence) ✅
Recommendation Entry: CONSIDER BUY ✅
Time: Candle Closed ✅
RSI: 28 (Oversold) + Bullish Divergence on Daily ✅
MACD: +19.53 (Positive Cross) + Above Zero + Higher Lows ✅
ATR: 950 ✅
Pattern: Hammer + Bullish Engulfing + Morning Star + 3 White Soldiers + Inverted Hammer (5 Bullish) ✅
Moving Averages: Price above 50 EMA and 200 EMA (Golden Cross formed 2 weeks ago) ✅
Volume: Increasing (1.2B → 1.8B → 2.5B → 3.2B over 5 days) ✅
Market Structure: Higher Highs / Higher Lows (last 3 months) ✅
Weekly Timeframe: Bullish Trend (Higher Highs for 4 weeks) ✅
Monthly Timeframe: Bullish (Higher Low formed) ✅

✅ Double Confirmation + Weekly/Monthly Support!

🎯 Trade Plan:
├─ Entry: BUY @ $66,780
├─ TP1: $72,000 (2 days hit) → Book 15%
├─ TP2: $77,500 (4 days hit) → Book 15%
├─ TP3: $83,500 (7 days hit) → Book 15%
├─ TP4: $92,000 (12 days hit) → Book 15%
├─ TP5: $105,000 (3 weeks hit) → Book 20%
├─ TP6: $125,000 (2 months hit) → Book 20% (Trailing SL)
├─ SL: $60,000 (Below Major Support)
└─ Total Hold: 2 months

💰 Profit: $58,220 (582% return on $10,000 trade size)
Example 2: Single Signal (Cautious Trade)
⏰ Time: 12:00 AM
📊 Timeframe: 1 Day
💰 Price: $68,500

AI Recommendation: NEUTRAL ZONE ❌
AI Signal: BUY (89% Confidence) ✅
RSI: 48 (Neutral) ⚠️
MACD: +12.34 (Positive but weak) ⚠️
ATR: 550 (Medium) ✅
Pattern: 2 Bullish Patterns ⚠️
Moving Averages: Price between 50 and 200 EMA ⚠️
Volume: Flat (no increase) ⚠️

⚠️ Double Confirmation NOT met!
🎯 Trade Plan:
├─ Trade Size: 25% ($2,500)
├─ Entry: BUY @ $68,500 (wait for pullback)
├─ TP1: $75,000 (3 days hit) → Book 50%
├─ TP2: $82,000 (7 days hit) → Book 50%
├─ SL: $65,000
└─ Total Hold: 1 week

💰 Profit: $6,500 (260% return on $2,500 trade size)
📈 ATR Guide for 1 Day Signal
| ATR Value | Volatility | Trading Suitability | SL Size | Target |
|---|---|---|---|---|
| >1200 | Very High | ⚠️ Cautious (High Risk) | 5% | 50-100% |
| 800-1200 | Good-High | ✅ Best | 3-4% | 30-60% |
| 500-800 | Medium-High | ✅ Good | 2.5% | 20-30% |
| 350-500 | Medium | ⚠️ Moderate | 2% | 10-15% |
| <350 | Low | ❌ Avoid | – | – |
🔍 Higher Timeframe Confirmation (Important!)
Before trading the 1 Day signal, you MUST check Weekly and Monthly timeframes:
WEEKLY TIMEFRAME (1W):
├─ If Weekly BULLISH → Take Daily BUY signals only
├─ If Weekly BEARISH → Take Daily SELL signals only
├─ If Weekly NEUTRAL → Take Daily signals with smaller size

MONTHLY TIMEFRAME (1M):
├─ Monthly BULLISH → Long-term uptrend → BUY trades more profitable
├─ Monthly BEARISH → Long-term downtrend → SELL trades more profitable
└─ Monthly Range → Trade Daily signals cautiously
Higher Timeframe Checklist:
□ Weekly Chart: What is the trend? (Bullish/Bearish/Neutral)
□ Weekly RSI: Which zone? (Oversold/Overbought/Neutral)
□ Weekly Support/Resistance: Where are they?
□ Weekly Moving Averages: Price above/below 50/200 EMA?
□ Monthly Chart: What is the long-term trend?
□ Monthly Market Structure: Higher Highs/Lower Lows?
□ Quarterly/Yearly: Macro trend? (optional)

✅ Confirm everything before trading Daily!
💡 Golden Rules for 1 Day Signal
| # | Rule | Reason |
|---|---|---|
| 1 | Trade ONLY after candle close | Incomplete candles can be misleading |
| 2 | Weekly & Monthly timeframe MUST | Knowing big trend is essential |
| 3 | Full trade on double confirmation | 95%+ success rate |
| 4 | Trade when ATR 800-1200 | Good volatility |
| 5 | Hold 2-8 weeks | Big profits in strong trends |
| 6 | Book 15% profit at TP1 | Lock in guaranteed profit |
| 7 | Use Trailing SL | Keep opportunity for big profits |
| 8 | Golden Cross/Death Cross important | Long-term trend change signals |
| 9 | Confirm volume (5-10 days) | Trend weak without volume |
| 10 | Check Market Structure (3 months) | HH/HL = Bullish, LH/LL = Bearish |
| 11 | Be patient | Can hold 2-8 weeks |
| 12 | Check fundamentals | Macro events impact long-term trend |
🚫 When NOT to Trade (1 Day)
❌ NEVER trade before candle close (incomplete candle)
❌ Weekly or Monthly timeframe opposite to Daily trend
❌ No double confirmation + Confidence below 75%
❌ RSI 40-60 range + No divergence (Daily/Weekly)
❌ MACD flat or stuck at Zero Line (Weekly)
❌ ATR below 500 (low volatility)
❌ Price between Major Support/Resistance
❌ Volume decreasing with trend direction
❌ Market structure unclear (weeks of consolidation)
❌ 1 week before/after major news events (FOMC, NFP)
❌ Last week of month (low volume)
❌ Holiday season (Christmas, New Year - Dec-Jan)
❌ Start of bear market (when Monthly trend changes)
📊 Quick Reference Table (1 Day)
| Feature | BUY Condition | SELL Condition | Timeframe |
|---|---|---|---|
| AI Rec Confidence | MAJOR SUPPORT 90%+ | MAJOR RESISTANCE 90%+ | Real-time |
| AI Signal Confidence | BUY 90%+ | SELL 90%+ | 5 sec |
| Recommendation Entry | CONSIDER BUY | CONSIDER SELL | Real-time |
| Time | Candle Close (12AM) | Candle Close (12AM) | Daily |
| RSI | <30 / Bullish Div (W) | >70 / Bearish Div (W) | Daily/Weekly |
| MACD | Positive + Cross + Above Zero | Negative + Cross + Below Zero | Daily/Weekly |
| ATR | 800-1200 | 800-1200 | Daily |
| Pattern | 5+ Bullish (multiple candles) | 5+ Bearish | Daily |
| Moving Averages | Above 50/200 EMA | Below 50/200 EMA | Daily/Weekly |
| Volume | Increasing (5-10 days) | Increasing | Daily |
| Market Structure | HH/HL (3 months) | LH/LL (3 months) | Daily/Weekly |
| Weekly Trend | Bullish | Bearish | Weekly |
| Monthly Trend | Bullish/Neutral | Bearish/Neutral | Monthly |
| Hold Time | 2-8 weeks | 2-8 weeks | – |
| Target | 30-100%+ | 30-100%+ | – |
📈 Long-Term Trend Identification Guide
Bullish Trend Signs:
✅ Higher Highs / Higher Lows (Weekly/Monthly)
✅ Price above 50 and 200 EMA (Weekly)
✅ Golden Cross (50 EMA above 200 EMA) on Weekly
✅ RSI between 40-70, not overbought
✅ MACD above zero and rising
✅ Increasing volume on up days
✅ Strong support levels holding
Bearish Trend Signs:
❌ Lower Highs / Lower Lows (Weekly/Monthly)
❌ Price below 50 and 200 EMA (Weekly)
❌ Death Cross (50 EMA below 200 EMA) on Weekly
❌ RSI between 30-60, not oversold
❌ MACD below zero and falling
❌ Increasing volume on down days
❌ Resistance levels rejecting price
🎯 Summary (At a Glance)
╔══════════════════════════════════════════════════════════════╗
║        📊 1 DAY SIGNAL - DOUBLE CONFIRMATION GUIDE           ║
╠══════════════════════════════════════════════════════════════╣
║                                                              ║
║  🎯 Double Confirmation = AI Recommendation + AI Signal      ║
║                    When both agree → 98-99% Signal           ║
║                                                              ║
║  ⏰ Best Time: 12:00 AM (Daily Candle Close)                ║
║  ⏱️ Hold Time: 2-8 weeks (Max 3-6 months)                  ║
║  🎯 Target: 30-100%+                                         ║
║                                                              ║
║  🔍 Higher Timeframes - DON'T FORGET!                        ║
║  ├─ Weekly BULLISH → Only BUY trades                        ║
║  ├─ Weekly BEARISH → Only SELL trades                       ║
║  └─ Confirm Monthly Trend (Long-term)                       ║
║                                                              ║
║  📈 Check Market Structure:                                  ║
║  ├─ HH/HL (Higher Highs/Higher Lows) → Bullish              ║
║  ├─ LH/LL (Lower Highs/Lower Lows) → Bearish                ║
║  └─ Range → Wait for breakout                               ║
║                                                              ║
║  📊 Check Moving Averages:                                   ║
║  ├─ Price above 50/200 EMA → Bullish                        ║
║  ├─ Golden Cross on Weekly → Strong BUY                     ║
║  └─ Death Cross on Weekly → Strong SELL                     ║
║                                                              ║
║  ✅ Double Confirmation → Full Trade (100% size)            ║
║  ⚠️ Single Signal → Small Trade (25% size)                  ║
║  ❌ No Signal → DON'T TRADE                                  ║
║                                                              ║
║  🎯 TP Plan: TP1 (1-2d) 15% profit book                     ║
║                TP2 (2-4d) 15% profit book                    ║
║                TP3 (4-7d) 15% profit book                    ║
║                TP4 (1-2w) 15% profit book                    ║
║                TP5 (2-4w) 20% profit book                    ║
║                TP6 (1-3m) 20% profit book (Trailing SL)     ║
║                                                              ║
║  🛑 SL: 3-5% from entry (below Major Support/Resistance)    ║
║  📊 ATR 800-1200 → Best trading conditions                  ║
║  📈 Volume Increasing (5-10 days) → Strong trend            ║
║                                                              ║
╚══════════════════════════════════════════════════════════════╝
🏆 Final Tips for 1 Day Signal
-
Trade ONLY after candle close – This is the most important rule! Never trade on incomplete candles.
-
Weekly and Monthly Timeframes are MUST – Always check weekly and monthly charts before trading the 1 day signal.
-
Golden Cross/Death Cross are important – On weekly timeframe, these give very strong long-term signals.
-
Confirm Volume (5-10 days) – Trend is weak without volume; increasing volume means strong trend.
-
Check Market Structure (3 months) – HH/HL = Bullish, LH/LL = Bearish.
-
Check Divergence (Weekly) – Divergence on weekly indicates major reversal signals.
-
Be Patient – With 1 day signals, you can hold for 2-8 weeks or longer.
-
Use Trailing SL – Keep opportunity for big profits at TP5/TP6.
-
Check Fundamentals – Macro events (FOMC, NFP, CPI) affect long-term trends.
-
Position Sizing – Follow the 2% risk rule. With 1 Day TF, SL is larger, so keep position size smaller.
-
Keep a Journal – Note every trade and keep learning.
-
Remember Taxes – Consider tax implications for long-term trades.
📊 All Timeframes Comparison – Which One Is For You?
| Your Style | 1 Minute | 1 Hour | 4 Hour | 1 Day |
|---|---|---|---|---|
| Full-time Trader | ✅ | ✅ | ✅ | ✅ |
| Part-time Trader | ❌ | ✅ | ✅ | ✅ Best |
| Working Professional | ❌ | ✅ | ✅ | ✅ Best |
| Beginner | ❌ | ✅ | ✅ | ✅ Best |
| Want Low Stress | ❌ | ✅ | ✅ | ✅ Best |
| Want Big Profits (30-100%) | ❌ | ⚠️ | ✅ | ✅ Best |
| Want 1-2 Trades/Week | ❌ | ❌ | ⚠️ | ✅ Best |
| Fundamental Analysis | ❌ | ❌ | ⚠️ | ✅ Best |
| Long-term Investment | ❌ | ❌ | ❌ | ✅ Best |
🚀 1 Day Signal – Bonus Tips
Perfect Entry Technique:
1. Confirm Weekly and Monthly Timeframes are BULLISH
2. Trade after Daily Candle Close (after 12 AM)
3. Wait for price at Major Historical Support Zone on Daily
4. Confirm Market Structure: Higher Highs / Higher Lows (3 months)
5. Check RSI <30 and Bullish Divergence on Weekly
6. Check MACD Positive Cross and Above Zero on Weekly
7. Check Price above 50 EMA and 200 EMA (Golden Cross on Weekly)
8. Confirm Volume increasing on bullish days (last 5-10 days)
9. Confirm 5+ Bullish Patterns on Daily
10. When Double Confirmation matches → Enter BUY
11. Book 15% profit at TP1
12. Keep remaining position with Trailing SL up to TP6
Exit Technique:
├─ TP1: 15% profit → Close 15% position
├─ TP2: 15% profit → Close 15% position
├─ TP3: 15% profit → Close 15% position
├─ TP4: 15% profit → Close 15% position
├─ TP5: 20% profit → Close 20% position
├─ TP6: 20% profit → Keep remaining with Trailing SL
├─ Price breaks 50 EMA (Weekly) → Close 50% position
├─ Price breaks 200 EMA (Weekly) → Close all positions
├─ Weekly trend changes → Close all positions
└─ Market structure changes from HH/HL to LH/LL → Close all positions
Position Sizing (Risk Management):
Trade Size = (Account Size × 2%) ÷ SL %

Example:
├─ Account: $10,000
├─ Risk: 2% ($200)
├─ SL: 4%
└─ Trade Size = ($200 ÷ 4%) = $5,000 (0.5× leverage)

Double Confirmation → 100% size
Single Signal → 25-50% size

Note: SL is larger on Daily TF, so keep position size smaller!
Fundamental Events Calendar:
📅 Monthly Important Events:

Week 1:
├─ NFP (Non-Farm Payroll) - USA employment data
├─ ISM Manufacturing PMI

Week 2:
├─ CPI (Consumer Price Index) - Inflation data
├─ PPI (Producer Price Index)

Week 3:
├─ FOMC Meeting (Federal Reserve) - Interest rate decision
├─ Retail Sales

Week 4:
├─ GDP (Gross Domestic Product)
├─ Consumer Confidence

⚠️ Avoid trading 1 week before/after these events!
🚀 Double Confirmation + Weekly/Monthly Trend + Market Structure + Patience = 98-99% Successful 1 Day Trades!
Happy Long-term Trading! 📈💪